EV To EBIT Meaning
EV to EBIT is the ratio between enterprise value, which encompasses the entire company’s value instead of just the market capitalization and earnings before income taxes, which gives information about how much business a company has successfully done over a certain period. It is one of the most important valuation tools used in the finance industry.
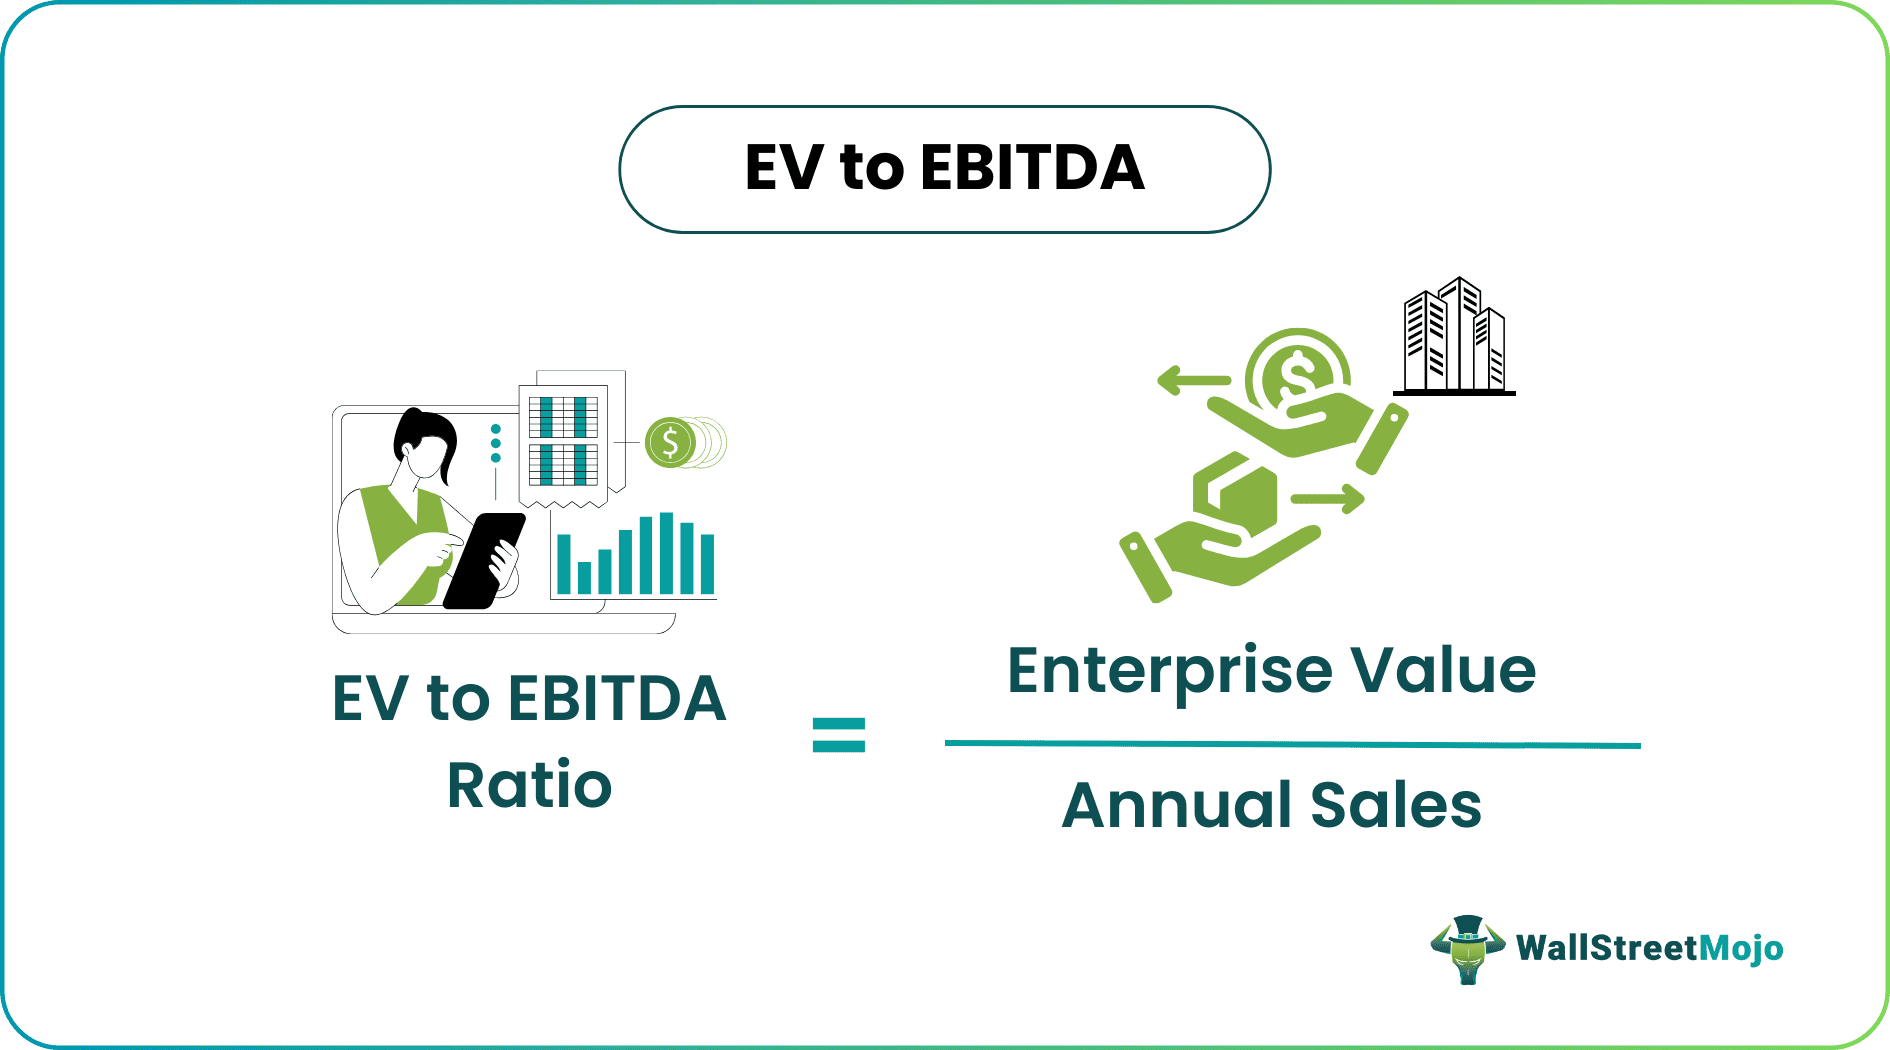
EV to EBIT helps assess the earning yields and compare the same with respect to the interest and taxes they are liable to pay. It lets investors know if the stocks are highly-priced.
Key Takeaways
- The Enterprise Value to Earnings Before Interest and Taxes (EV/EBIT) ratio plays a pivotal role in company valuation.
- In contrast to the conventional Price-to-Earnings (P/E) ratio, the EV/EBIT stands out by delving into the intricacies of the balance sheet.
- Notably, the EV/EBIT ratio excels in its capacity to appraise firms impartially, irrespective of their capital structure.
EV To EBIT Explained
EV to EBIT refers to the ratio between the total value of the organization and the earnings recorded before the interest and tax deductions. It allows investors to evaluate the prices of the stocks made available by the companies. This, in turn, helps them learn if the stocks are overvalued, undervalued, or appropriately priced. The EV-to-EBIT multiple has the unique benefit of valuing a firm despite its capital arrangement, making the ratio attractive among analysts.

Image Source: Financial Modeling and Valuation Course Bundle
To understand what EV to EBIT ratio is, it is important to know what Enterprise Value (EV) and Earnings Before Interests and Taxes (EBIT) are and how they work.
Enterprise Value
Enterprise Value is the total value of the firm. Enterprise value depicts the value to the overall stakeholders, including the debt holders, shareholders, minority shareholders, and preference shareholders.
The formula for Enterprise value is as follows.
EV = Market Cap + Debt + Minority Interest + Preference Shares – Cash & Cash Equivalents.
Enterprise value can be considered the total consideration at which the investor can buy the company. It implies that the buyer will also assume the company’s debt, which he will have to pay off.
EBIT
Let us have a look at the Income Statement of Colgate above. Is the Operating profit in Colgate EBIT (Earnings Before Interest and Taxes), or EBITDA (Earnings Before Interest Taxes Depreciation & Amortization)?
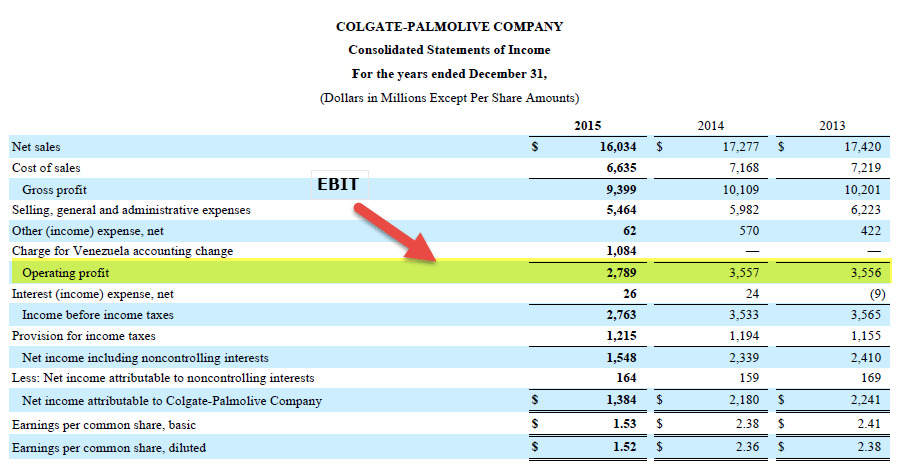
source: Colgate SEC Filings
The above Operating Profit of Colgate is EBIT. EBIT is defined as any company’s profit, including all expenditures just leaving income tax and interest expenditures. However, the EBITDA measure is good for analyzing and comparing profitability between firms and businesses as it removes the impacts of accounting and financing decisions.
Now that the EV and EBIT concepts are clear, the example below clarifies the concept of EV and EBIT together as a valuation tool.
Let us look at Facebook vs. General Motors Valuations from the above graph. Facebook is trading at EV to EBIT of 24.21x; however, General Motors’ multiple is around 9.16x. Does this mean that General Motors is trading cheap, and we should buy General Motors compared to Facebook?

Formula
EV/EBIT multiple answers the query “What is the company’s valuation worth per Operating Profit dollar.”
EV to EBIT formula = Enterprise Value / EBIT
Where
EV = Market Capitalization + Debt + Minority Interest + Preference Shares – Cash & Cash Equivalents)/EBIT
Interpretation
The above formula in detail measures if a company’s share is expensive or cheap compared to the broader market or competing firm.
- This ratio is an improved version of the traditional P/E multiple that overcomes the limitations of PE ratio as it also has a balance sheet. Therefore, rather than just using the company’s share price, the company employs enterprise value that includes debt.
- PE ratio is the most commonly used and easiest valuation technique to measure any company’s capability to deliver profits compared to the market. This multiple is occasionally used against the P/E multiple to relate profit expansion among companies in industries having huge quantities of debt like high capital intensive businesses.
- Key analysts most often study EV/EBIT to promptly identify the firm’s trading valuation multiples. A large or small multiple signifies that the firm is expected to be either overvalued or undervalued. Keeping all other things unchanged, the smaller this ratio comes out to be, the healthier.
- Investors are advised to go through any company’s EV to EBIT ratio and make it a core tool to identify the company’s earnings capabilities while also comparing it with other companies to get a clearer insight into which stock is best for investments at that point of time, in the short-term or over the longer term. Further, this ratio is generally believed to be used by Buffet and Greenblatt for determining any business’s health.
Calculation Example
Let us consider the following example on Amazon to understand the concept better and also check how it is calculated:
Calculation of Enterprise Value = (Market Cap + Debt + Minority Interest + Preference Shares – Cash & Cash Equivalents)/EBIT
Market Capitalization = Number of Shares Outstanding x Current Price.

source: Amazon SEC filings
Amazon Share Price (as of 2/21/2017 closing) = 856.44
Number of outstanding shares (as of last reported 10K) = 477 million
Amazon Market Capitalization = 856.44 x 477 = 408,522 million
- There are no Preferred Shares on Amazon
- There is no component of Minority Interest
- Amazon’s cash and cash equivalents are $19,334 million.

source: Amazon SEC filings
Amazon has a very small amount of debt on its balance sheet.

source: Amazon SEC filings
Amazon’s Enterprise value = Market Cap + Debt + Minority Interest + Preference Shares – Cash & Cash Equivalents
Amazon’s Enterprise value = 408,522 million + 7,694 + 0 + 0 – 19,334 = $396,882 million ~ $396.88 billion

source: Amazon SEC filings
Amazon’s EBIT of 2016 is $4,186 million.
Amazon’s EV to EBIT = $396,882/ $4,186 = 94.81x
Types
EV to EBIT ratio is also known as EV multiple and is divided into two categories:
- Trailing Multiple: It is the multiple calculated over the previous 12 months.
- Forward Multiple: It is, on the other hand, the EV multiple that is calculated over the next 12 months.
The formula remains the same. However, the difference is in the calculation of the EBIT, which differs before and after 12 months used for calculating the trailing multiple and the forward multiple.
Let us look at the example below to understand how they are used.
There are six companies A, B, C, D, E, and F.

You are provided with the Current Price, Enterprise value, EBIT, and EV to EBIT forecasts of all six companies. You need to find the following –
- Which company will you invest in?
- Which company is the worst from the valuation point of view?
Which company should you invest in?
The answer to this question lies in the knowledge of trailing and forward multiple.

Please take a look at the table above. You will note that EV to EBIT is lowest for company B in 2016A at 26.7x, while it is highest for Company D at 80.0x. It makes us believe that Company B is the cheapest. However, this is an incorrect conclusion! You should never value a firm based on what has already happened in the past. Instead, you should give more weight to the company’s future, and therefore forward EV/EBIT becomes critical. If you take forward EV to EBIT of Company B, you will note that it increased dramatically to 40.0x in 2018. On the other hand, the lowest forward multiple is that of Company D. This is what you should look at from the investment point of view.
Which company is the worst from the valuation point of view?
Again, the answer lies in analyzing the estimated EV to EBIT. We note that even though Company B had the cheapest multiple in 2016 (at 26.7x), its EV to EBIT continuously increased to 33.3x and 40.0x in 2017 and 2018, respectively. It happened due to a decrease in EBIT in 2017 and 2018.
Also, note that even though Company C has a higher multiple (48.6x) than that of Company B (40.0x), going by the trend, it seems like Company B will be worse off in 2019E.

Uses
The EV to EBIT ratio is used in different sectors to help investors evaluate how the stocks of particular companies are valued. Let us see the way in which these multiples can be effectively used in different sectors:
Services Sector
Services companies do not have a large asset base; their business model is dependent on Human Capital (employees). Due to this, depreciation and amortization in Services Companies are generally non-meaningful.
The difference between EBIT margin and EBITDA margin can tell us the relative amount of depreciation and amortization in the Income Statement. It is expected from a services firm as they operate as an Asset Light model. The graph below notes that the difference between EBIT Margin and EBITDA Margin for Infosys is approximately 1.24% (27.34% – 26.10%).

source: ycharts
Since the difference between EBIT and EBITDA is not much, you can easily use EV/EBIT or EV/EBITDA for a Software company’s valuations.
Other services sectors where you can apply EV to EBIT are –
- Internet Tech & Content
- Software Applications
- Advertising Agencies
- Marketing Services
Oil & Gas Sector
Oil & Gas companies are Capital Intensive companies that invest heavily in plants and manufacturing setup and are dependent on continuous investments in assets to manufacture finished products. Therefore, its depreciation and amortization are relatively higher with a higher asset base.
Now let us compare the above graph with that of Exxon. Exxon is an Oil & Gas company (highly capital intensive firm). We note that the difference between EBIT Margin and EBITDA margin is very high – approximately 8.42% (13.00% – 4.58%). Heavy investments in Plant Property and Equipment lead to high depreciation and amortization figures.

source: ycharts
Using this multiple in the Oil & Gas sectors will be incorrect due to the presence of higher depreciation and amortization. Higher depreciation and amortization can lead to very low EBIT values. Additionally, depreciation policies may differ between companies, with one following the and the other with the accelerated depreciation method. Therefore to make the right comparison, EV to EBITDA is the correct valuation multiple in this case.

Image Source: Valuation Course
Other sectors where we should avoid using EV to EBIT (preferable use EV to EBITDA) are the high capital intensive sectors like –
- Manufacturing
- Utilities
- Automobile Sector
- Mining
- Energy
- Telecom
Frequently Asked Questions (FAQs)
What is the importance of EV-to-EBIT ratio?
The Enterprise Value to Earnings Before Interest and Taxes (EV/EBIT) ratio is important in financial analysis and investment decision-making. This ratio serves as a powerful tool for investors, analysts, and financial professionals to gain insights into a company’s valuation and operational performance. By considering both the enterprise value, which includes market capitalization, debt, and minority interests, and the EBIT, which reflects the company’s operating profitability before accounting for financing and tax-related factors, the EV/EBIT ratio offers a comprehensive view of a company’s worth relative to its core earnings generation.
What is a good EV-to-EBIT ratio?
A good EV/EBIT ratio varies by industry, but a lower ratio is generally favorable. It suggests that the company’s earnings can more effectively cover its valuation, potentially indicating an attractive investment opportunity.
Is EV/EBITDA better than EV/EBIT?
EV/EBITDA (Enterprise Value to Earnings Before Interest, Taxes, Depreciation, and Amortization) is often better than EV/EBIT. EV/EBITDA provides a broader view by including non-cash expenses, offering a more comprehensive assessment of a company’s operational efficiency and financial health.
Recommended Articles
This article has been a guide to EV To EBIT and its Meaning. Here, we explain the concept with formula, example, interpretation, uses, and types. If you are looking for related financial articles for references, here are a few articles: