Table Of Contents
What Are Mistakes in Discounted Cash Flows(DCF)?
There are many mistakes one has to be aware of during the discounted cash flow model of valuation; forecast horizon to make sure the investor selected the right amount of time; beta value to see if the correlation is corrected and it is being associated with the right market; equity risk premium which should be correct and growth rate which should neither be too optimistic or pessimistic.
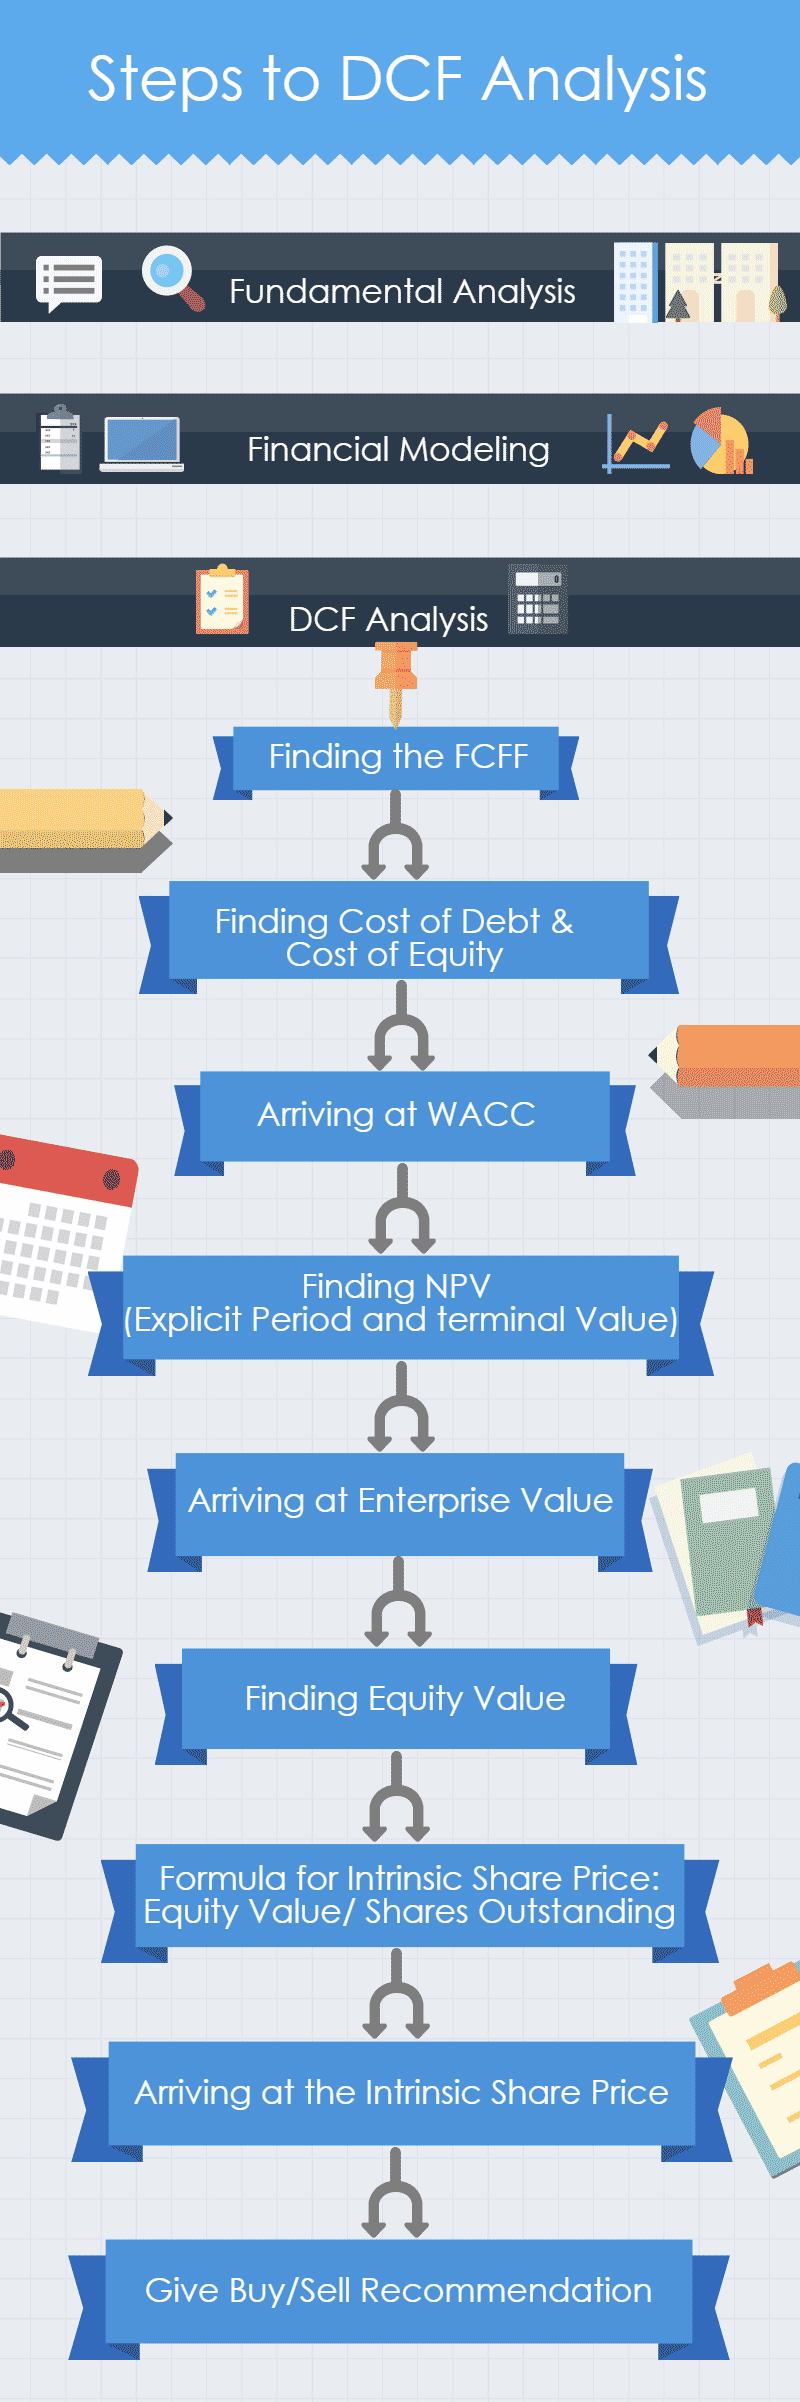
Before directly jumping to the list of mistakes, the following are the infographics that highlight all essential steps to DCF Analysis. This is to brush up on some crucial terms in DCF analysis. This will help you while we look at the mistakes in the other part. Yes, we make Valuation models, but are we 100% correct? Even small mistakes can hugely affect your analysis. So let's try to decode some major mistakes in discounted cash flow analysis. In this article, we discuss them.
Mistakes In Discounted Cash Flows Explained
It is very obvious that mistakes in Discounted Cash Flow can affect our analysis and the answer is a bit, YES!
DCF is a very commonly used process that helps an analyst to evaluate an investment or a project using its future cash flows. In this way it is easy to decide whether the project will be viable for the business or not.
But it requires proper understanding of the DCF process in order to avoid any mistake in its assumptions and inputs because that can make the entire decision take a very different turn. Any error can lead to acceptance of impractical or unusable investment or even, on the contrary, loss of important opportunity for the business.
Some important inputs in the model are growth rates, discount rate, terminal value, beta and equity risk premium. But any kind of over or underestimation of the above can lead to incorrect analysis. It is good to have a positive outlook about growth rates, but it is necessary to remember that high growth encourages high competition and ultimately growth reduces over time, if there is no consistent monitoring and innovation.
Beta should consider the nature of business, debt and leverage levels and should be of sector based. Even terminal value calculation, which is the business’s value at the end of cash flow period, is tricky and proper model should be selected for the same. Any inconsistent method adopted for the same will distort the final result. Selection of long-term government bonds as the risk-free or discount rate in the model works as the best option.
Improper estimation of depreciation and tax amounts can lead to incorrect valuation. Sometimes there are various costs that arise due to integration of certain projects of business process. They should be identified and adjusted for to make the DCF effective.
Video Explanation Of DCF
DCF Infographics: Steps by Step Analysis
 Ok, so moving forward to our main topic of discussion.
Mistakes
#1 - Getting a Sell recommendation despite a strong Buy!
This is how the recommendation analysis works.
- It's a BUY Recommendation when: Intrinsic Share Price > Current Market Price (is Greater than)
- It's a SELL Recommendation when: Intrinsic Share Price < Current Market Price (is Less than)
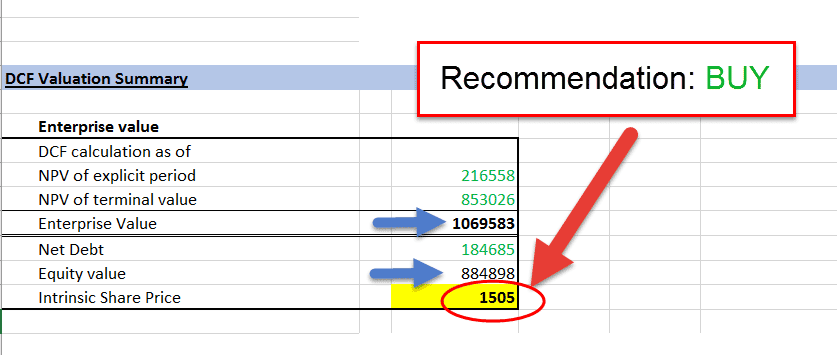
In our case, the results were as follows:
- No Mistakes in Discounted Cash Flow gave a BUY Recommendation as = Intrinsic Share Price > Current Market Price, as 1505 > 1153
- Mistakes in Discounted Cash Flow gave a SELL Recommendation as Intrinsic Share Price < Current Market Price, as 418 < 1153.
You must be curious about which mistakes I made? How are the Intrinsic Values differing so much? Now, present the mistakes I deliberately made in the Discounted Cash Flow Analysis. Let's analyze them one by one.
- Forecast Horizon: Too Much or Too Less!
- Cost of Capital: A Challenge?
- Growth Rate Assumptions: Extreme?
#2 - Forecast Horizon: Too Much or Too Less!
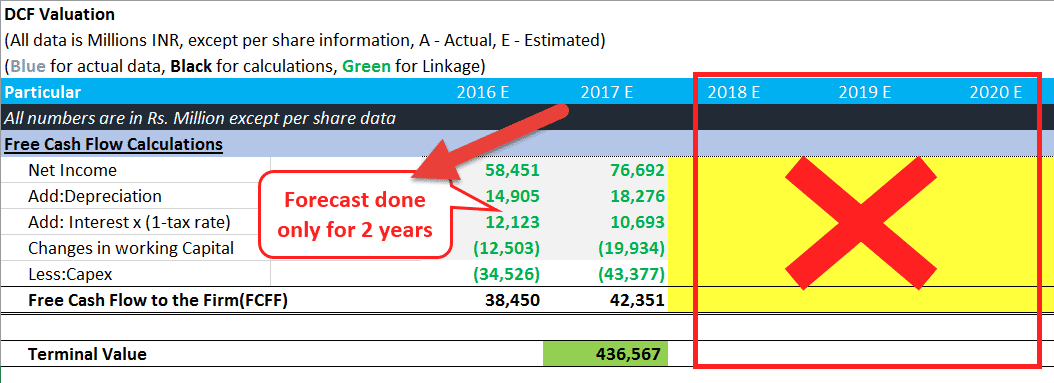
Consider that you are valuing an FMCG company. But you perform financial projections for only two years. Do you think that it is the right approach? Definitely not!
A time frame of at least five to seven years needs to be considered while performing DCF analysis. But this does not mean that you consider the time frame of 50 years; that would be wrong.
Imagine the interest rates, economic factors, and inflation after 50 years! And we do not have any financial superpower to predict the same. So from now on, for each the mistake, we will list down specific values taken for:
Forecast Horizon - Without Mistakes
We have considered the forecast period of 5 years for the analysis.
Forecast Horizon - With Mistakes
- Forecasting is done only for two years.
Considering a short forecast period does not give you the effect of different parameters in the coming years. Instead, it largely affects the intrinsic share price.
Hence it is essential to take a proper explicit period that is not too short or not too long.
#3 - Cost of Capital: A Challenge?
Many DCF modes are built on the non-sensible cost of capital. This is one of the significant mistakes in Discounted Cash Flow.
Here is the reason why.
- Most companies use either debt or equity for financing their operations.
- The cost of the debt part for large companies is usually transparent as they have to make contractual obligations by way of coupon payments.
- But estimating the cost of equity is more challenging.
- Because, unlike debt's explicit cost, the cost of equity is implicit.
- Also, the cost of equity is usually higher than the cost of debt, as equity's claim is junior. And no simple method exists to estimate the most accurate cost of equity.
- The most common and used approach for estimating the cost of equity is the capital asset pricing model (CAPM).
- According to CAPM, the company's cost of equity is equal to the risk-free rate plus the product of the equity risk premium and beta.
- Government-issued bonds generally provide a good representation of the risk-free rate. But estimating the equity risk premium and beta proves much more challenging.
We will now analyze the effect of two important considerations of the CAPM in our analysis: Beta & Equity Risk Premium.
Beta:
This is what Beta is:
- Beta reflects the sensitivity of a stock's price movement relative to the broader market.
- A beta of 1 suggests that the stock tends to move in line with the market.
- A beta below 1 means that the stock moves less than the market.
- A beta above 1 implies that the stock moves greater than the market.
- Beta, though it sounds wonderful in theory, fails practically and empirically.
- Ideally, we want forward-looking betas, which are difficult to estimate reliably.
- Beta's empirical failure shows how beta does a poor job explaining returns.
Beta Value - Without Mistakes:
- We have taken the Beta value from a trusted source https://www.reuters.com/.
- In our case, the beta value fetched from Reuters for the company is 0.89
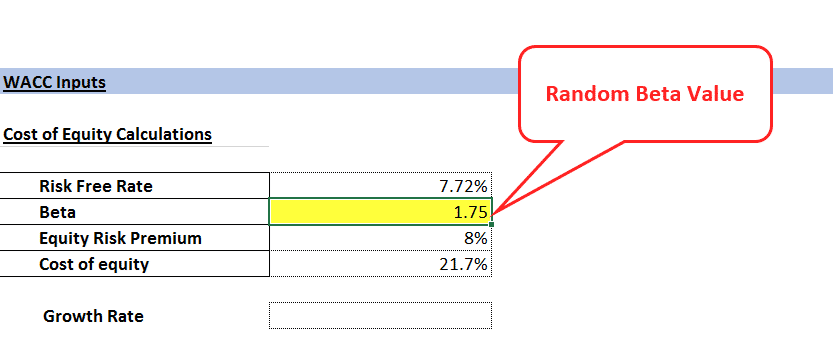
Beta Value With Mistakes:
- The beta value is randomly considered.
- Thus the Beta Value, in this case, is 1.75.
Equity Risk Premium:
- The second important input of CAPM, which can cause errors, is the equity risk premium.
- Like the beta, the equity risk premium is a forward-looking estimate.
- Relying on past equity risk premium values may not give a good sense of the return outlook.
- Research also suggests that the equity risk premium is possibly non-stationary.
- Thus using past average values can be very misleading.
Equity Risk Premium - Without Mistakes:
Understand the following:
- The risk-free rate is the rate of return on your investment with no risk and no loss.
- Generally, the Government Bond rate is considered in this case.
- Search, and you will easily get the risk-free rate value for the Government bond.
- The Indian Government Bond rate that I fetched was 7.72%.
- As an investor in the Stock Market, the general expectation is to get more returns than the risk-free rate.
- Let's consider the return expectations between 10%-15%.
According to the Capital Asset Pricing Model, the formula for calculating the calculate the required rate of return:
=Rf + β(Rm-Rf), Where,
- Rf is the risk-free rate
- β is the Beta Value
- (Rm-Rf) is the equity risk premium
So if the investor is expecting 12% returns, let's see how the values will fit in our formula:
To make the LHS equal to RHS:
12%= 7.72%+0.89*(?)
(?)= 4.81
Thus the equity risk premium, in this case, is 4.81
Assuming a percentage in the range of 4.5%-5.5% may give you the proper value.
I have taken the equity risk premium of 5% in our correct analysis.
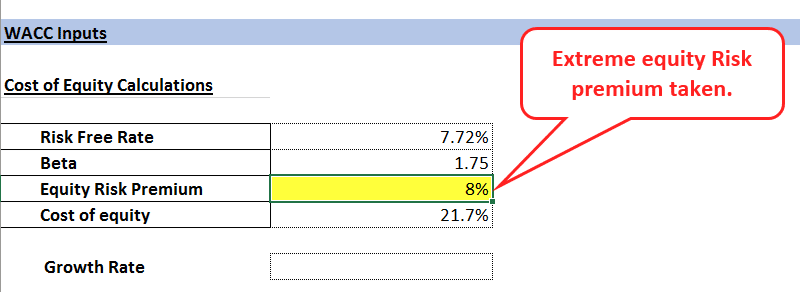
Equity Risk Premium - With Mistakes:
- The equity risk premium is randomly considered.
- Thus the Value, in this case, is 8%.
#4 - Growth Rate Assumptions: Extreme?
- Consider yourself as an insurance agent. You can get many customers; you have overachieved your targets. But how?
- By promising the clients aggressive returns of 30%, with a surety of cumulative increase each year;
- You were able to fool the clients, but can you fool yourself?
- You cannot guarantee your clients some extreme growth figures. Things do not work like that.
- You have to consider all the possible factors that affect the growth rate.
The same is the case when you build your DCF model.
Generally, the long term growth rate assumptions are taken wrong. However, these assumptions are taken to determine the terminal value component of the DCF valuation.
You have to bear in mind that the long-term growth rate should not exceed the sum of inflation and real GDP growth at the most.
Growth Rate - Without Mistakes:
- Growth rate assumptions should always be considered less than the country's GDP.
- Considering this, I have taken the growth rate to 5%. (Less than India's GDP, which is in the range of 7%)
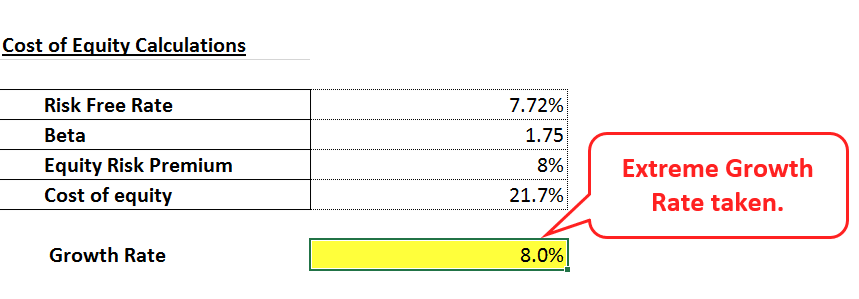
Growth Rate - With Mistakes:
An extreme Growth percentage of 8% assumed. (More than the GDP growth rate).
These are some common mistakes made in the discounted cash flow analysis. This will help us to analyze the extent of differences in the values. So let's sum up the differences in our analysis. These are the results that we got:
Intrinsic share price
- With Mistakes: 418
- Without Mistakes: 1505
BUY/SELL recommendation
- With Mistakes: SELL
- Without Mistakes: BUY
The difference in the values from the actual analysis
=(1505-418)/1505 = 72% (HUGE!)
Apart from these above-stated mistakes, we have some other common errors as listed below:
- Unbalanced assumed investment and earnings growth.
- Other liabilities: Inappropriate considerations
- Changes in Numbers
- Double counting the values
- Real and Nominal Cash Flows
- Understanding the Market Conditions
- Tax rate errors
The above list is taken from http://www3.nd.edu/
#5 - Unbalanced assumed investment and earnings growth.
- Companies invest in the business via working capital expenditure, acquisitions, R&D, etc.
- All these steps are taken to grow over an extended period.
- Return on investment (ROI) helps determine the efficiency with which a company translates its investments into earnings growth.
- Since ROI is linked to investment and growth, investors must carefully treat the relationship between investment and growth.
- DCF models can sometimes underestimate the investment necessary to achieve an assumed growth rate.
The source of this mistake is as follows:
- For Companies that have been highly acquisitive in the past, Analysts consider the same growth rate now, even if the company is not that much into acquisitions.
- One can overcome this mistake by carefully considering the growth rate likely to come from today's business.
#6 - Other liabilities: Inappropriate considerations
Another mistake in Discounted Cash Flow is concerning other liabilities.
- Corporate Value is determined based on the present value of future cash flows.
- Cash and any other non-operating assets are added, while debt and liabilities are subtracted to arrive at shareholder value.
- Like employee stock options, some other liabilities are trickier and more challenging to analyze. Thus most analysts do an abysmal job analyzing these liabilities.
- At the same time, some liabilities are most common in some sectors.
- For example, post-retirement employee benefits plans are more common in manufacturing industries, while employee stock options frequently occur in service industries.
- Hence investors must properly categorize and recognize other liabilities in the sectors where they may have a massive impact on corporate value.
Also, check out Restricted Stock Units
#7 - Changes in Numbers
- Sometimes small changes in assumptions can also lead to massive changes in the value.
- Investors should also look to the value drivers like sales, margins, and investment needs as sources of variant sensitivity.
Double counting the values
- Always make sure that your model does not get into the mistakes of double counting. Now you must be wondering what exactly is double counting. So let's understand it in simple terms.
- Double counting means that some values are taken twice, causing errors in the model.
- Your intrinsic share price changes by considering the values twice;
- Double counting can also take place while considering the risk factor.
- There are two ways of taking into account the uncertainty of the future:
- Directly adjusting the cash flows in the model.
- Considering a discount rate;
- Hence if adjustments are made in both the above methods, it can lead to double counting of the risk, thus leading to an error.
#8 - Real and Nominal Cash Flows
Let's understand the difference between real and nominal cash flows.
- Nominal: Cash flows that incorporate the effects of inflation
- Real: Cash flows that exclude its effects are on a real basis.
- Thus, where real cash flows are used, the impact of inflation needs to be considered in the discount rate.
- Often errors are seen here as no adjustments are made.
#9 - Understanding the Market Conditions
- In some cases, income and operating statements for a particular project do not reflect normal operating patterns.
- Thus ultimately, this will affect your DCF model and the intrinsic share price.
- In such a case, it is necessary to reconstruct the actual operating statements to reflect market conditions.
- Projected operating or income statements must attempt to reflect actual market conditions.
#10 - Tax rate errors
- A general mistake made: Adopting a tax rate that does not reflect the long-term tax rate for the asset.
- To properly reflect expected future cash flows, forecasts should be based on the expected effective tax rate applicable.
- It is essential to devote some time to analyzing the corporate tax rate.
- Properly analyzing the tax rate and considering it in your model will surely bring it one step closer to perfection.
Impact Of Mistakes
To know this, I have performed a "Two" DCF analysis of the same company.
- Analysis 1: No Mistakes in Discounted Cash Flow
- Analysis 2: Mistakes in Discounted Cash Flow
If you compare these two analyses, there are small changes deliberately made in certain values. This will help us know Mistakes' impact on the Intrinsic share price and BUY/SELL recommendation.
Following is my final output from the Discounted Free Cash Flow Analysis. Again, check out the difference in the share price.
You can download the excel sheet containing formulas and calculations for with and without mistakes discounted cash flow analysis.
#1 - No Mistakes In DCF
#2 - Mistakes In DCF

Since you are now aware of all the probable things that can go wrong in DCF calculations, be well prepared. It is essential to ensure that the assumptions are economically sound and transparent. Even the slightest change in assumptions in Cost of Capital, growth rates, etc., can change the recommendation from BUY to SELL or vice-versa. Please remember that very few DCF models pass the NO MISTAKE DCF test.
Now that you have gained some insights into "Mistakes in Discounted Cash Flow," I hope that your analysis will stand apart. Happy Valuations!