Table Of Contents
Undervalued Stock Meaning
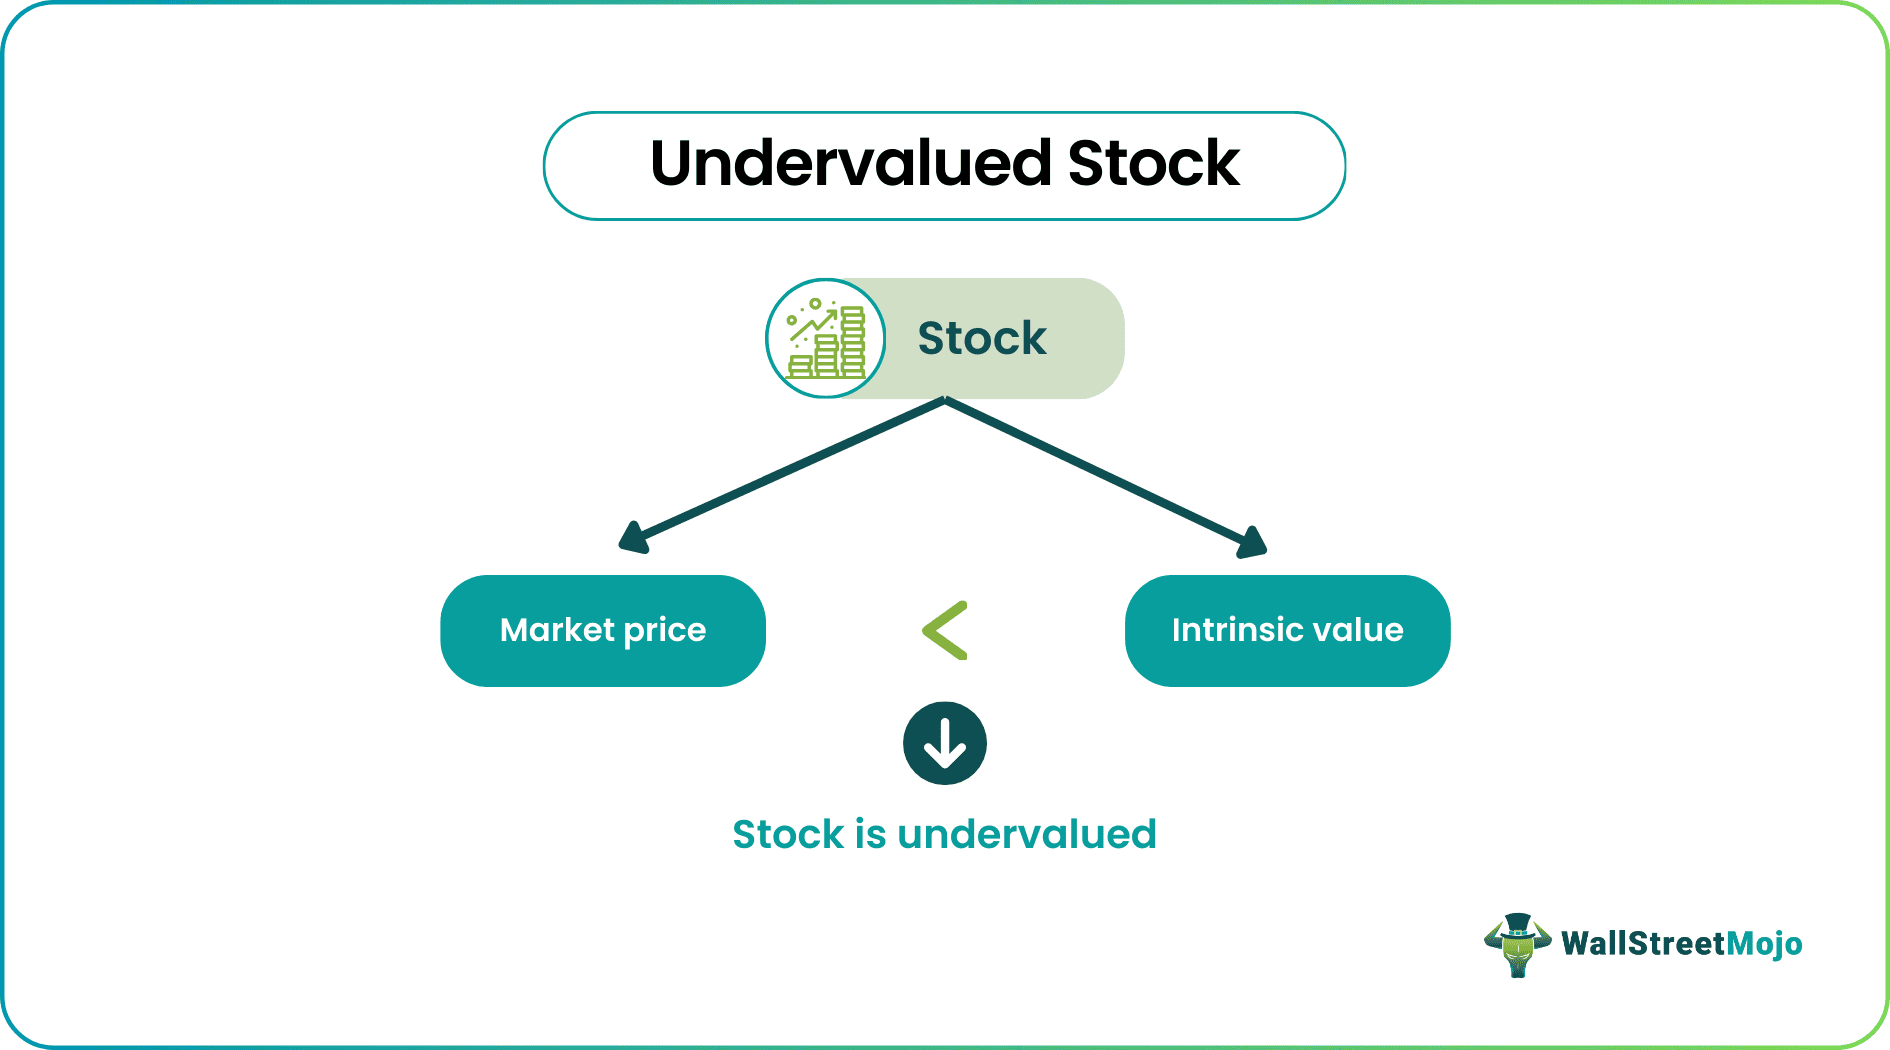
An undervalued stock is priced low; its market price is lower than its intrinsic value. Many investors tend to take advantage of this gap. This investment strategy is known as value investing. Prominent investors like Warren Buffet endorse this strategy. It is the opposite of an overvalued stock.
When investors purchase stocks, the intrinsic value is right at the top among the parameters that indicate potential. In an overvalued stock, the intrinsic value is lower than the market price is higher. Both under and over-valuations are market inefficiencies. It is important to note that over time, the market corrects itself.
Key Takeaways
- Undervalued stocks' market price is significantly lower than the intrinsic value.
- The intrinsic value depends on past performance, current performance, financials, and legal history. Investors use indicators like the P/E ratio, P/B ratio, net cash flow, and dividend yield to determine the intrinsic value.
- Undervalued shares offer the perfect opportunity to buy low and sell high. Inefficient market trends do not last very long; for investors, undervaluation signals an upcoming trend reversal.
- On the flip side, stocks can also be overvalued. Overvaluation is caused by market sentiments—positive news about the company or its potential growth. As a result, trending stocks are bought aggressively.
Undervalued Stock Explained
Undervalued stock can be identified easily by determining a stock’s intrinsic value. Intrinsic value refers to the net present value of expected cash flows. This is an important parameter for investors; it shows them what they can expect from a stock.
Investors can leverage the gap between intrinsic value and market price. Naturally, a stock with a high intrinsic value would increase in price. Investors can buy low and sell high (capital appreciation). But in practice, it is never that simple; the measurement of intrinsic value is somewhat subjective. Perception plays a significant role—it depends on what investors think about a firm and their confidence.
Undervalued shares support a bullish rally and let investors make good profits. Conversely, undervalued shares are also called 'oversold.' Such a scenario is often witnessed at the end of short-term declines—it signals the beginning of an upward rally.
An overbought market is an opposite; the stock price is about to decline. Asset prices cannot be one-directional for long. Sooner or later, the trend reverses. To generate maximum profits, investors purchase before the trend reversal.
Indicators
Now, let us discuss undervalued stock indicators.
#1 - Price-To-Earnings Ratio
The P/E ratio of a stock is the ratio of market price to returns per stock. This parameter helps understand the earning potential of a stock. It determines if a stock is worth purchasing. Ideally, the price should be less for maximum gains, and earnings should be more.
Example: The market price of stock A is $100. In 2022, it generated returns of $10 per stock. Therefore, the P/E ratio is 100/10 = 10.
#2 - Price-To-Book Ratio
A company's book value can be defined as the net value of its assets divided by the total shares issued. The ratio of this value to the per unit stock price is called the P/B ratio.
Here, the market price is lower than its book value. Of course, the undervaluation could be due to financial crises as well. Ideally, the P/B ratio should be below one.
Example:
- Total assets of Company B = $10,000,000
- Total stocks issued = 100,000
- Market price of stock = $110
- Book value = (10,000,000/100,000) = 100
- P/B ratio = 110/100 = 1.1
Therefore, the stock is not undervalued.
#3 - Net Cash Flow
Net cash flow is the difference between cash inflows and outflows. Inflows should always exceed outflows. Only then can a company clear debt, return to investors, and other liabilities. If a firm clears liabilities comfortably, it can expand further.
Cash outflows usually include operating expenses and capital expenditures. Inflows include interests, revenue from sales, etc. A positive net cash flow shows that the business isn't making any losses. As a result, investors prefer such stocks—a reliable investment opportunity.
Example:
- Company X Revenue = $500,000
- Direct and indirect expenses = $400,000
- Interest from investments = $10,000
Should an investor purchase this share?
Here, the cash inflow is $510,000, greater than the cash outflow of $400,000. Thus, cash flow is positive. Therefore, It is a promising investment opportunity.
#4 - Price-To-Earnings Growth Ratio
The PEG ratio is often considered an extension of the P/E ratio. The stock price is also considered along with the company's earnings growth. This ratio is more comprehensive than the P/E ratio and shows whether the company has grown.
The PEG ratio can be determined by dividing the P/E ratio by the earnings growth rate. Ideally, the value should be less than one, but it can vary from industry to industry. A lower PEG ratio shows that the stock is undervalued and to what degree.
Example:
- Earnings per share (EPS) for Company Y in 2021 = $10
- EPS in 2022 = $12.
- Stock's market price = $100.
- P/E ratio = 100/12 = 8.33
- Earnings growth rate = 2/10 = 20%
- PEG ratio = 8.33/20 = 0.4166
#5 - Price-To-Sales Ratio
The P/S ratio is defined as the ratio of sales per share. Here, the company’s 12-month sale is considered (most recent year). A low P/S ratio suggests undervaluation. Of course, the ratio can also be calculated for a particular quarter. But studying the values over the years gives a better idea of the firm's growth potential.
Example:
- Company Z sales in 2022 = $100,000,000
- Total outstanding stocks = 10,000
- Share price = $100
- Sales per share = 10,000
- P/S ratio = 100/ 10,000 = 0.01
#6 - Dividend Yield Ratio
This parameter shows the ratio of dividend per share to the price per share. Thus, it signifies the number of dividends a particular stock generates concerning its price. This value can be compared across years to understand how the stock performs. The ideal value should lie between 2% and 6%.
Example:
- Price per stock (Company A) = $50
- Dividend per stock = $2
- Dividend yield ratio = 2/50 = 4%
The indicators mentioned above are popular. But there are many more indicators—past financial performance, credit rating, performance during crises, future scope, and compliance history.
Example
Let us look at an undervalued stock example.
Lower Saxony in Germany is the second-largest shareholder of Volkswagen, with an 11.8% stake and 20% voting rights. Lower Saxony believes that Volkswagen is undervalued significantly.
The board of directors believes that the battery division can enhance the valuation. But the firm is not considering any immediate capital appreciation. The company's battery division is expected to generate €20 Billion by 2030.
Undervalued Stock vs Overvalued Stock
Let us look at undervalued stock vs overvalued stock comparisons to distinguish between them.
- The main point of difference is the variation between the intrinsic value and the share price. When the intrinsic value is more, the share is undervalued; when the share price is high, the share is overvalued.
- Generally, undervalued shares are favored over overvalued ones, as the investors buy low and sell high. If the company is performing well, it can give promising returns. Buying an overvalued share doesn't have this advantage, as the price returns to its intrinsic value, which is lower.
- However, it is all a matter of perception. What one investor considers intrinsic value may not match the estimation of another investor.
- Both undervalued and overvalued shares pose risks. For example, undervalued shares run the risk of faulty analysis or wrong estimation. In contrast, overvalued stocks can succumb to capital depreciation when the market corrects itself.