Part of our Valuation Methods guide
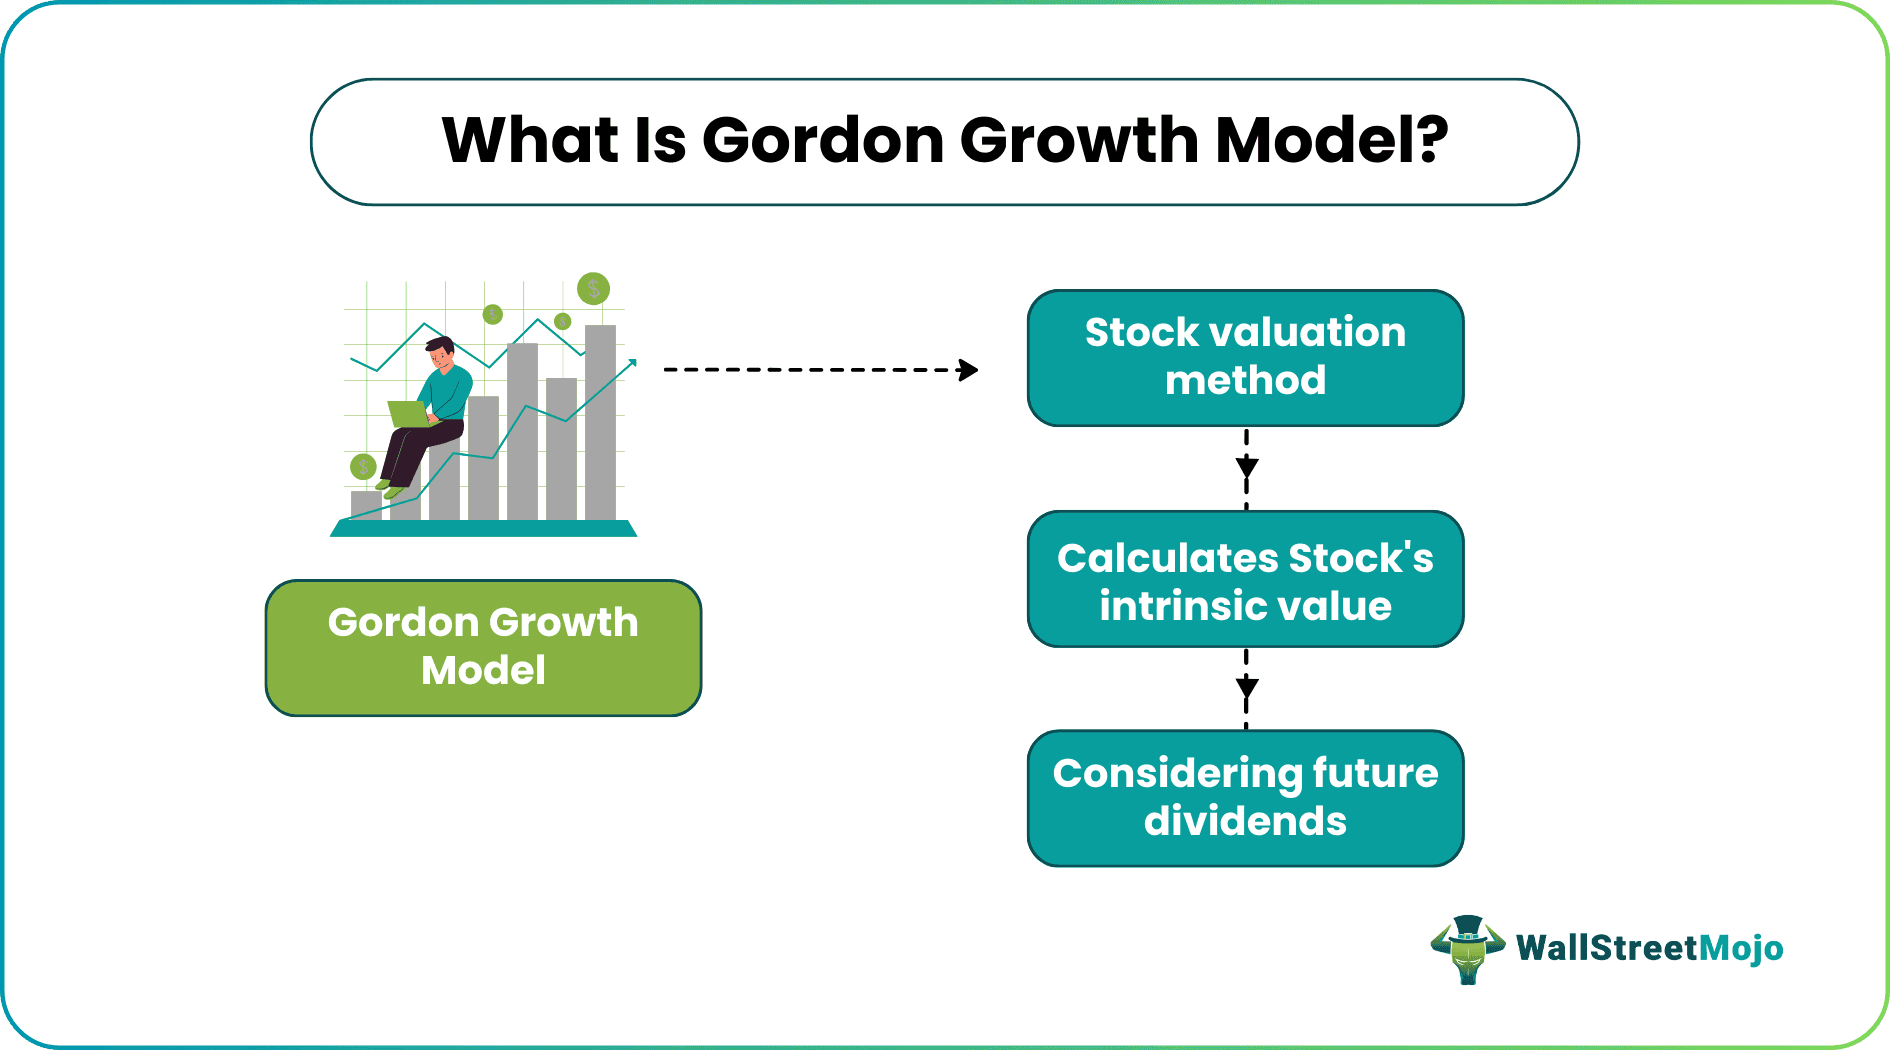
What Is The Gordon Growth Model?
Gordon growth model refers to the expression that helps calculate the fair value or the intrinsic value of a stock and assesses it with respect to the future series of dividends. The dividends considered are the ones that hrow at a constant growth. The resultant tells investors and entities if the stocks are overvalued or undervalued.
In this model, the current market conditions are not taken into account. It is a type of dividend discount model in which the dividends are factored in and discounted. In this model, a growth rate for the dividends is also factored in, and the stock price is calculated based on that.
Key Takeaways
- The Gordon Growth Model is a dividend discount model in which the dividends are factored in and discounted.
- In this model, a dividend growth rate is also factored, and the stock price is evaluated.
- This Model is helpful for companies with stable cash flow and limited business expenses.
- The Gordon Growth Model does not consider market situations. Therefore, it can determine or compare different sizes and industries companies.
Gordon Growth Model Explained
Gordon Growth Model (GGM) helps compute the intrinsic value of the stocks based on the mathematical expressions depending on the infinite number series progressing a constant rate. Here, the firms take into consideration the stock value and study it against the sum of the dividend payouts for the upcoming years. The resultant is compared to the current market value of the same stocks and hence, entities and individuals get to know if those stocks are undervalued or overvalued.
GGM takes into account three elements, which include:
- Dividends per share (DPS) – It is the annual payment that companies payout to their equity shareholders.
- Growth rate in DPS – This is the figure that reveals the rate at which the dividend payout increases from one year to another.
- Required rate of return – It is the minimum rate of return that the investors are ready to accept when they buy a stock of a company.
Applying the Gordon Growth Model is simple, but it emerges as one of the most efficient metrics to find out how justified the current value of a stock is. If the value obtained is higher than the current price at which the stocks are trading, they are considered undervalued and are eligible to be bought. On the contrary, if the value obtained is lower than the current trading price of the shares, the stock is said to be overvalued and hence it is eligible for a sale.
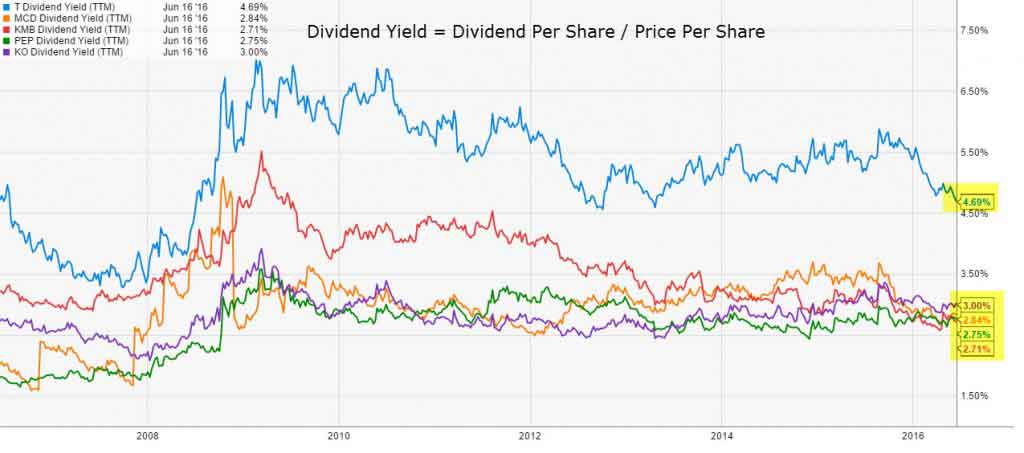
As per the Gordon growth Formula, the stock’s intrinsic value equals the sum of the present value of the future dividend. We note from the above graph companies like McDonald’s, Procter & Gamble, Kimberly Clark, PepsiCo, 3M, Coca-Cola, Johnson & Johnson, AT&T, and Walmart pay regular dividends. Therefore, we can use the Gordon growth model to value such companies.
There are two basic types of the model: the stable and multistage growth models. The stable model assumes that the dividend growth is constant over time. However, the multistage growth model does not think of the constant growth of dividends. Hence, we have to evaluate each year’s dividend separately. However, eventually, the multistage model assumes constant dividend growth.
Let us now see the Gordon growth formula and examples for each model type and stock price calculation.
Video Explanations of Gordon Growth Model

Formula
The Gordon Growth Model formula that is used for calculating the intrinsic value of stocks is given below:
Using a stable model, we get the value of the stock as below:
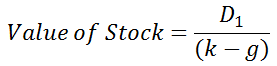
Where,
- D1: it is next year’s expected annual dividend per share
- ke: discount rate or the required rate of return estimated using the CAPM
- g: expected dividend growth rate (assumed to be constant)
Examples
Let us consider the examples below to understand how to calculate the stock value using Gordon Growth Model equation:
Example 1
Let us assume that ABC Co. will pay a $5 dividend next year, which is expected to grow at 3% yearly. Further, the required rate of return for the investor is 8%. So, what is the intrinsic value of the ABC Co. stock?
Intrinsic Value Formula of the stock using the Gordon growth model calculation:

Note that we have assumed a constant growth of dividends over the years. It could be true for stable companies. However, dividend growth could vary for growing/declining companies. Hence, we use the multistage model. Thus, using the stable model, the value of a stock is $100. If the stock is trading at, e.g., $70, it is undervalued. On the other hand, if the stock is trading at $120, it is overvalued.
Example 2 – Walmart Stable Dividends
Let us look at Walmart’s dividends paid in the last 30 years. Walmart is a mature company. However, we note that the dividends have steadily increased over this period. It means we can value Walmart using the Gordon growth model calculations.
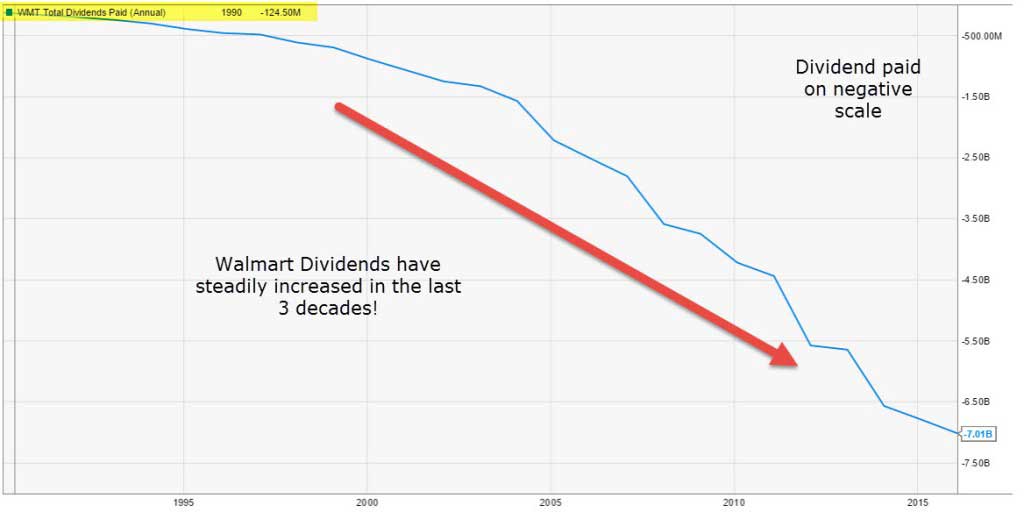
source: ycharts
Example 3
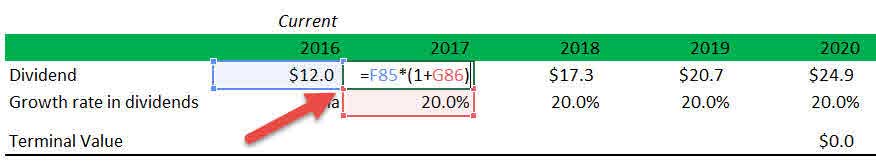
Let us take a Gordon growth multistage example of a company wherein we have the following: –
- Current Dividends (2016) = $12
- Growth in Dividends for 4 years = 20%
- Growth in Dividends after 4 years = 8%
- Cost of Equity = 15%
Find the value of the firm using the Gordon growth model calculations.
Step 1: Calculate the dividends for each year till the stable growth rate is reached
Here, we will calculate the high-growth dividends until 2020, as shown below.
The stable growth rate is achieved after 4 years. Hence, we calculate the Dividend profile until 2020. The Gordon Growth Model in Excel has been represented in this example:
Step 2: Calculate Gordon Growth Model Terminal Value (at the end of the high growth phase)
Here, we will use the Gordon growth model for terminal value. We note that the growth stabilizes after 2020. Therefore, using this model, we can calculate the Gordon growth model terminal value in 2020.
It can be estimated using the Gordon Growth Formula –
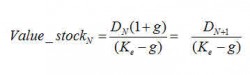
As seen below, we have applied the Excel formula to obtain the TV or terminal value at the end of the year 2020.
Gordon Growth Model Terminal value (2020) is $383.9
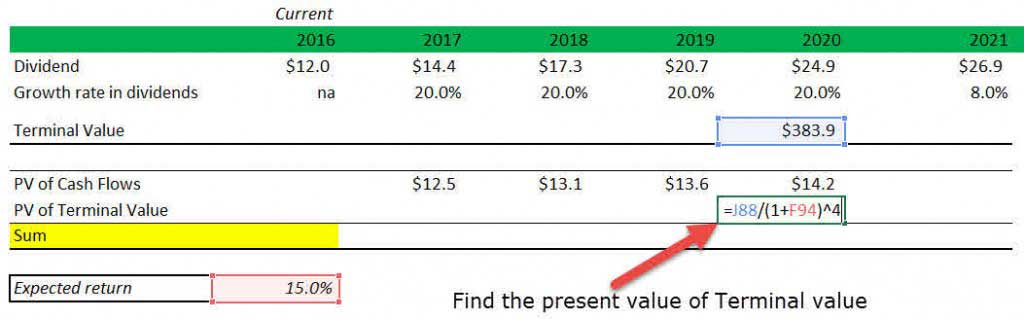
Step 3: Calculate the present value of all the projected dividends
The present value of dividends during the high growth period (2017-2020) is below. Please note that the required rate of return in this example is 15%.

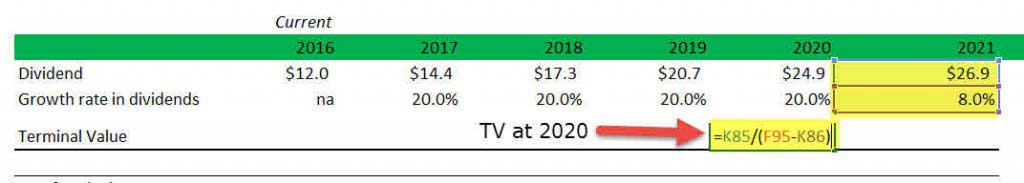
Step 4: Find the present value of the Gordon Growth Model Terminal Value
Present value of Terminal value = $219.5
Step 5: Find the Fair Value – the PV of Projected Dividends and the PV of the Terminal Value
We already know that the stock’s intrinsic value is the present value of its future cash flows. Now, since we have calculated the present value of dividends and the present value of Terminal Value, the total of both will reflect the fair value of the stock.
Fair Value = PV(projected dividends) + PV(terminal value)
Fair Value comes to $273.0

Assumptions
Although Gordon’s growth model is simple to understand, it is based on several critical assumptions. Thus, it has its limitations. However, the model can be used for stable companies having a history of dividend payments and future growth. On the other hand, the multistage model can be used for more unpredictable companies by taking some more realistic assumptions into account.
The assumptions of the Gordon Growth Model formula are as follows: –
- It is believed that the company will grow at a constant rate.
- The company has stable financial leverage or no financial leverage involved in the Company.
- The life of the firm is indefinite.
- The required rate of return remains constant.
- The company’s free cash flow is paid as a dividend at constant growth rates.
- The required rate of return is greater than the growth rate.
Advantages And Disadvantages
Gordon Growth Model helps individuals and entities find out whether a stock is currently undervalued or overvalued. When the value is obtained, it makes it easier for investors to know if they paying more for a stock or less. In addition, the companies get to know how worthy their stocks would prove in the long run. Thus, this model has a lot of advantages.
Besides the advantages, there are a lot of disadvantages and limitations of the model as well. Listed below are the pros and cons of the model. Let us have a quick look at them:
Pros
- Gordon’s growth model is beneficial for stable companies. Companies with good cash flow and limited business expenses.
- The valuation model is simple and easy to understand with its inputs available or can be assumed from the company’s financial statements and annual reports of the Company.
- The model does not account for market conditions. Hence, it can evaluate or compare companies of different sizes and industries.
- The model is widely used in the real estate industry by real estate investors and agents whose cash flows from rents and their growth is known.
Cons
- The assumption of constant dividend growth is the main limitation of the model. It will be difficult for companies to maintain continuous development throughout their life due to different market conditions, business cycles, financial difficulties, etc.
- If the required rate of return is less than the growth rate, the model may result in a negative value; thus, the model is ineffective in such cases.
- The model does not account for market conditions or other non-dividend-paying factors like the company’s size, brand value, market perception, and local and geopolitical factors. All these factors affect the actual stock value; hence, the model does not provide a holistic picture of the intrinsic stock value.
- The model cannot be used for companies with irregular cash flows, dividend patterns, or financial leverage.
- The model cannot be used for companies in the growing stage with no dividend history, or one can use it with more assumptions.
Frequently Asked Questions (FAQs)
When to use Gordon Growth Model?
The Gordon Growth Model calculates the present value of an endless series of future dividends, assuming that dividends will continue to grow indefinitely. The approach is applied to businesses with stable growth rates in dividends per share because it implies a consistent growth rate.
What are the assumptions of the Gordon Growth Model?
The Gordon growth model determines a company’s stock value based on the presumption that dividend payments to common equity shareholders would continue to grow. The GGM erroneously assumes that a business will always exist and continually pay rising dividends per share.
What are the weaknesses of the Gordon Growth Model?
The Gordon growth model determines a company’s stock price based on the supposition that dividend payments to its familiar equity owners will increase steadily over time. The GGM assumes that a business will always exist and pay increasing dividends per share.
What is r in Gordon Growth Model?
The needed rate of return (r) in the Gordon Growth Model equals 1. It is the same as the firm’s equity capital cost. g is the anticipated rate of dividend growth. Investors can base their decisions on the business’s historical average or projected long-term dividend growth.
Recommended Articles
This article is a guide to what is the Gordon Growth Model. Here, we explain the concept with formula, examples, assumptions, advantages, and disadvantages. You may also have a look at related articles on valuation: –