RANKX Function in Power BI
The RANKX function in Power BI works similarly to the one in the excel RANK function and assigns rank based on numbers of the specific or mentioned column. Below is the syntax of the RANKX Power BI DAX function.
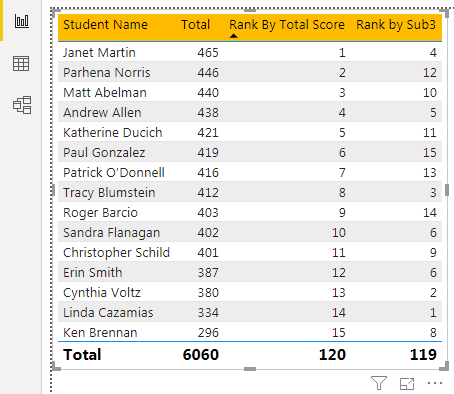
Table: We need to specify based on which table you are ranking.
Expression: We must supply the column name here based on which column you are ranking.
Value: This is a bizarre argument unless you are ranking at the advanced level. This argument will not put to use. So don’t worry about this argument at this point in time.
Order: In this argument, we can mention whether the ranking is in the form of ascending or descending order. The default parameter is in descending order, i.e., it will rank the top value 1, and so on.
We can supply two arguments here: TRUE or FALSE. TRUE is for ascending order, i.e., the lowest value is 1. If you supply FALSE, it will rank in descending order. Therefore, the highest value is 1.
Ties: This is the important thing you need to learn. In this argument, we can specify what should be done if there is a TIE between two values.
- If you SKIP this, the rank after the tied value will be the rank of the tied value plus a count of tied values. So, for example, if there are 3 values tied at 5th rank, then the next rank will be 8 = (5+3).
- If you supply DENSE as the option, the next value after the tied rank will be the next rank of the tied values. So, for example, if there are 3 values tied at 5th rank, then the next rank will be 6 = (5+1).
Example of RANKX Function in Power BI
Below is an example of a RANKX function. To apply this function in Power BI, we have created the below data in Excel.
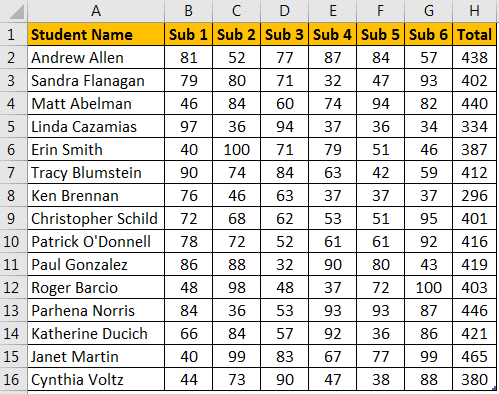
It is the data of marks obtained from 6 subjects. Then, based on different parameters, we will rank these students.
Copy and paste the data directly to Power BI. Else, you can copy it to an Excel file and then import it to Power BI as an Excel file reference. So, you can download the Excel workbook template from the link below, which is used for this example.
We have directly uploaded the data to Power BI.

You can use the RANKX function in the following steps.
Go to the “Report” view.

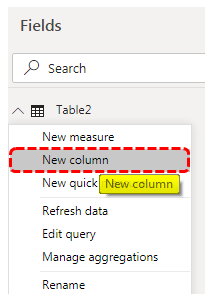
In the “Fields” section, right-click on the table name and choose “New column.”

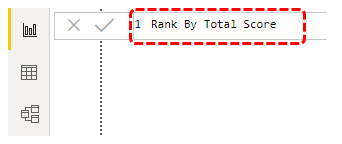
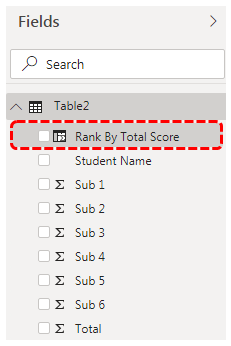
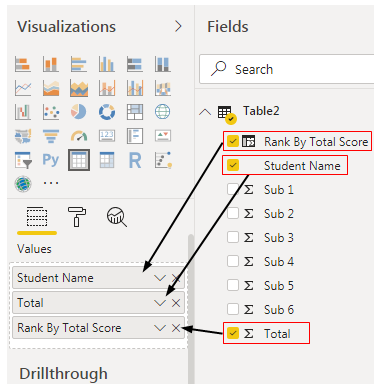
First, we need to enter what should be the column name. We will name it “Rank By Total Score.”

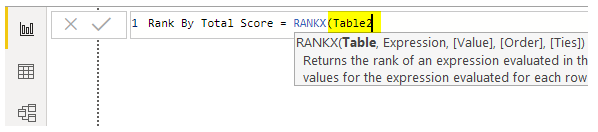
For this new column, open the Power BI RANKX function.

The table is the first parameter of this function, so our table name is “Table2,” and supplies the same.

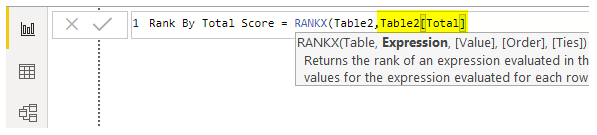
Expression is nothing but based on which column value we need to rank. Based on “Total,” we are ranking in this case so that we will supply the same.

Close the bracket and press the “Enter” key to get this new calculated column in the table.

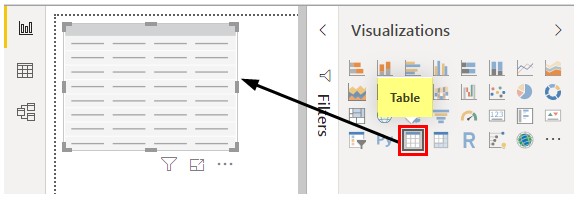
Now, insert a blank “Table” visual to see how our RANKX formula works.

Drag and drop “Student Name,” “Total,” and the newly calculated column, i.e., “Rank By Total Score,” to the “Values” field of the “Table” visual.

It will give us each student’s RANK against the total score.

So, we have a ranking based on the scores of each student.By using the RANK column, we can sort the data. Place a cursor on a rank column to see a small down arrow key.

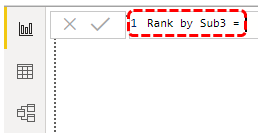
Now, assume you want to rank students based on “Sub3” scores. For this, insert one more column.

Once again, open the Power BI RANKX function and supply the TABLE name.

For Expression, instead of the “Total” column, supply the “Sub 3” column.

Press the “Enter” key. We will have a new calculated column.

For the existing table, only insert this newly calculated rank column, “Rank by Sub3,” in the “Values” field.

Now, we can see the table with the old and new rankings.


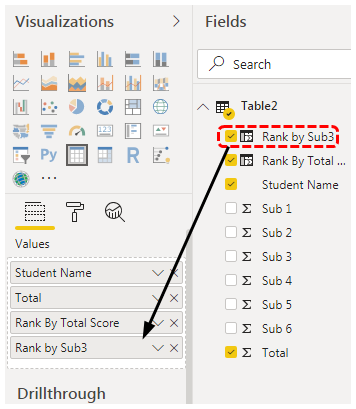

The first student, “Janet Martin,” was ranked as 1 based on the total score column but based on “Sub 3,” he is ranked as 4.
Note: We have done so much formatting to this table. You can download the Power BI RANKX template from the link below and apply each formatting technique as applied.
Things to Remember
- We can skip optional arguments by entering a comma.
- If we want different ranking techniques in case of a tie, we must use the “TIE” argument of the function.
- The first two arguments are mandatory, and the rest are optional.
Recommended Articles
This article has been a guide to Power BI RANKX. Here, we learn how to use the Power BI RANKX function to get the rank based on particular column numbers with the help of an example. You can learn more about Power BI from the following articles: –