Running Total in Power BI
Power BI seems to be a little difficult for MS Excel users because we work with cells in Excel. So, by using cell references, we can work easily, but when it comes to Power BI, we no longer work with cells but with entire columns and rows. It is where beginners in Power BI face huge challenges. For example, one of the users’ requirements in Power BI is how we get the running total or cumulative total of values. This article will show you how to write DAX formulas to get a running total in Power BI.
What is Running Total in Power BI?
Running total is the summation of values of each period before arriving at the overall period totals. For example, look at the below data in the Excel worksheet.
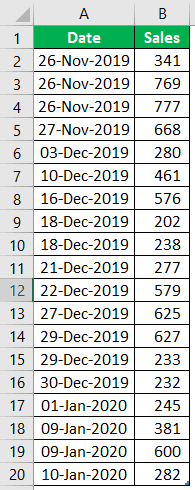
These are the daily sales numbers, so the running total arrives each period with the previous period’s numbers. For the above data, we can apply the running total like below.
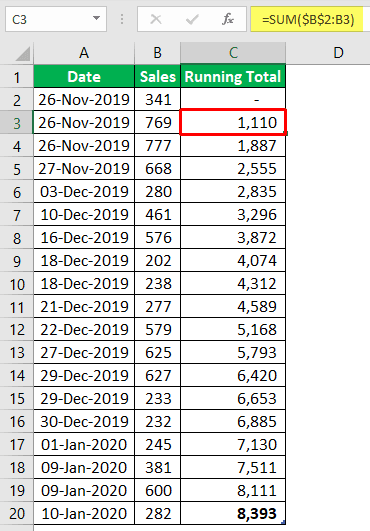
The first running total is the total of the first two days, 341 + 769 = 1110. Next, it will add three days numbers 341 + 769 + 777 = 1887. In the end, we get to know the pattern of each day.
Learning Power BI allows users to analyze complex data, create interactive visualizations, and derive insights. Those looking to improve their data management skills using Power BI can explore this Basic Power BI Course.
Examples of Running Total in Power BI
Below are examples of the running total in Power BI. You can download the workbook using the same file we used in this example.
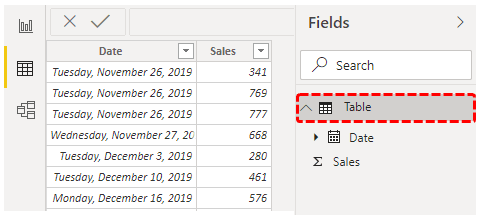
Similar stuff can also arrive in Power BI but not as easy as Excel. Use the same data as shown above in Power BI as well.
The steps to use running total in Power BI are as follows.
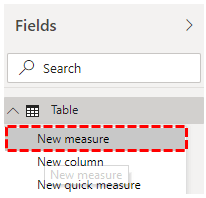
1. Select “Table” from the “Fields” section.
2. For this table, we can arrive at running totals in three ways. First, we will arrive through “New measure.” Then, right-click on the table and choose “New measure.”
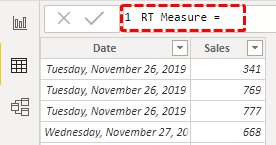
3. Name the measure as “RT Measure.” (RT= Running Total).
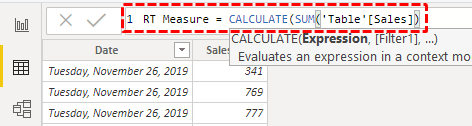
4. Open the CALCULATE function first.
5. The kind of expression we need to do with the CALCULATE function is “Summation of Sales Value.” So, open the SUM function and choose the “Sales” column.
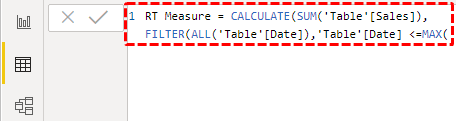
6. After applying the kind of calculation, we need to apply the filter to decide the criteria to be matched for calculation. Open the FILTER function now.

7. Before applying FILTER, we need to release any filter applied to the “Date” column. So, open the ALL function to remove the filter from the “Date” column.
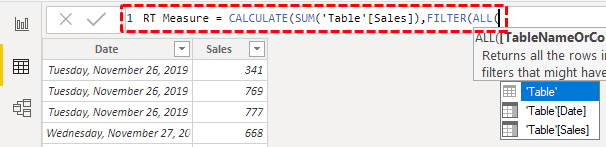
8. In this function, choose the “Table” or “ColumnName” for which we need to remove the filter, so choose the “Date” column
9. Once the filter is removed, we must apply new filter criteria in “Filter Expression.” So, for this again, choose the “Date” column.
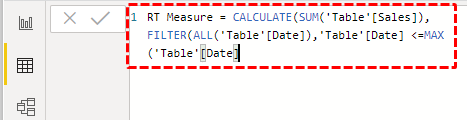
10. Once the “Date” column has been selected, we need to apply the kind of filter to be applied. For this, we need to decide the last date in the “Date” column, so enter the logical operator as less than (<) and open the MAX function.
11. The MAX function will find the last date in the “Date” column, so supply the “Date” column.
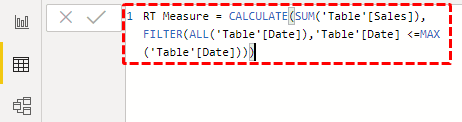
12. We are done. Close three brackets and press the “Enter” key to get the result.
13. Insert the table visually and add the “Date” and “Sales” columns first.
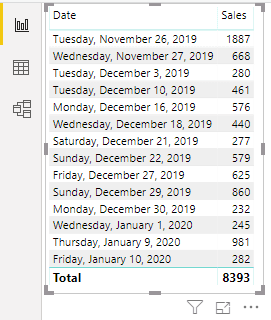
14. It is the overall summary. Add a newly created measure to the table to get the “Running Total” column.
Now, we have a running total measure.
We can also create a running total using another measurement technique, but this measure will only give different results.
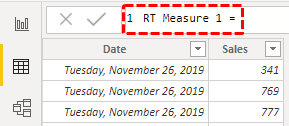
15. Name this measure “RT Measure 1”.
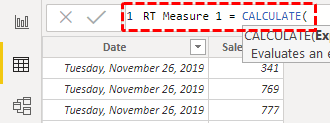
16. Open the CALCULATE function.
17. We need to summate the “Sales” column as we did in the previous method. So, open the SUM function and choose the “Sales” column to sum.
18. This time for filter criteria, we will use the DATESYTD function.
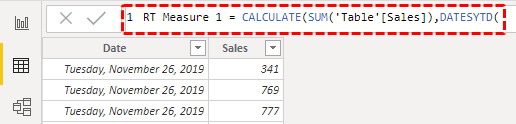
19. Choose the “Date” column for this function.
20. Close two brackets and press the “Enter” key to complete the formula.
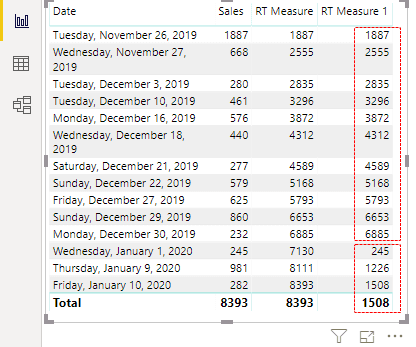
21. Now, add this new measure to our existing table visual and see the result.
We have got two different sets of running totals. The first running total ends at the end of the year on 31st December and the second running total starts from the new year date from 01st January.
Note: We can also download the Power BI dashboard file from the link below and view the final output.
Things to Remember
- We must always create a running total of new measures only to get perfect results.
- If you DATESYTD, it will only give the running total from 01st January to 31st December. Any dates after that will be started as a new running total from next year.
Recommended Articles
This article has been a guide to Power BI Running Total. Here, we learn how to write DAX formulas to get running total in Power BI and examples using the DATESYTD function. You may learn more about Power BI from the following articles: –