Table Of Contents
What are Measures in Power BI?
Power BI measures are the way of defining calculations in a DAX model, which helps us to calculate values based on each row. But rather, it gives us aggregate values from multiple rows from a table. Creating Power BI measures is often called "calculated measures," which use DAX expressions to calculate new values from the existing table.

Now, we will see how we can create new measures in Power BI to play with the existing data set. You can download the workbook used in this example to practice with us.
How to Create & Use Measures in Power BI?
We have already uploaded the data to Power BI, and the table has different columns, as shown below.

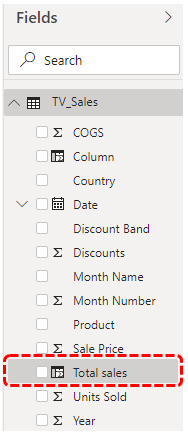
From this table, we do not have the "Total Sales" value to calculate the total sales value. However, we can insert the calculated column to calculate total sales.
- To add a new column, right-click on the table and choose "New Column" under the "Fields" section, as shown below.

- It will open up a new column section in the "Formula Tab."

- First, we need to give the column a name before we apply the DAX expression formula. Give the name as "Total Sales" and enter the formula as shown below.

- After the above formula, press the "Enter" key. We will have a new column in the table.

- Similarly, calculate two more columns for "Gross Profit" and Gross Profit %.
- Below is for Gross Profit (GP).

- Below is for Gross Profit % (GP%).

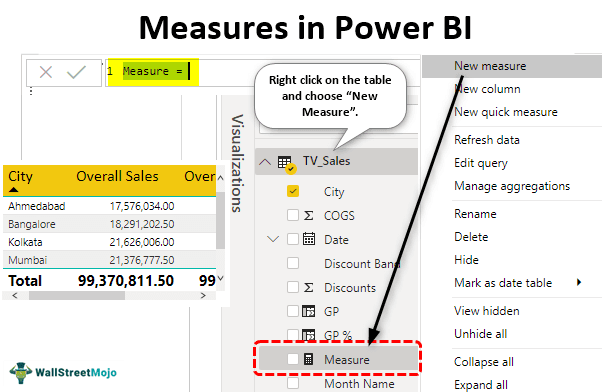
- Now, using these new columns, we can create "New Measures" to get the aggregate total values. Right-click on the table and choose "New measure."

- It will also create a new column similar to the above, but we could see the word "Measure."

- Now, if you want to get the amount of the overall sales, we can create that Power BI measure by using DAX expressions. But, first, give a name to the measure as "Overall Sales" and open the SUM DX function.

- As you can see above, the IntelliSense list started to show all the columns from the table. So, choose "TV_Sales."

- Close the bracket and press the "Enter" key to get the new measure in the table.

- Similarly, get the Gross Profit (GP) overall summary value in the new Power BI measure.

- Now, let us create one more new measure in Power BI to get the overall sales value against all the cities. For this, we need to use DAX functions and first open up the new measure.

- Before starting the DAX formula, you can insert a comment for this function by starting with two forward slashes.

- In the next line, you can continue the formula to jump to the next line and press the "Enter" key by holding the "ALT" key together.

- Open the CALCULATE function.

- For the Expression supply, we need to get the SUM. So, we must open the SUM function in excel inside the CALCULATE function.

- For the SUM function, choose the "Total Sales" column.

- The second argument is Filter 1 for this open ALL function.

- For this supply, select the "City" column.

- Close two brackets and press the "Enter" key to get this new Power BI measure.
- Using these measures, we can calculate each city's contribution percentage. Enter the new measure column and name it "Sales %."

- To calculate "Sales %," enter the formula "Overall Sales / All-City Sales * 100".

- Press the "Enter" key to finish the formula.
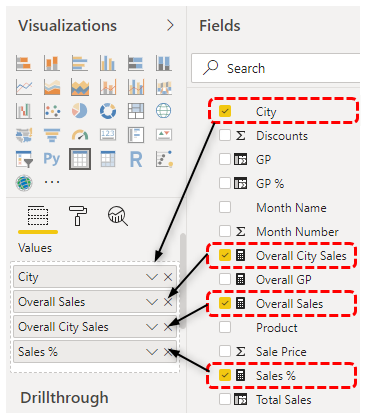
- Using these new measures, we will build a table to show each city's sales percentage. Insert "Table" visual from visuals.

- Now, drag and drop "City," "Overall Sales," "Overall City Sales," and "Sales %" to the "Values" field of the "Table" visual.

It should have created a visual of city-wise sales with their overall city-wise contribution.

Now, we can see Ahmedabad city has contributed 17.69 % to the overall sales value. So, using measures in Power BI, we can get the new values using DAX formulas.
Note: We can also download the Power BI dashboard file from the link below and view the final output.
Things to Remember Here
- Calculated columns and calculated measures are different from each other.
- Using measures, we can create aggregate totals.
- Almost all the measures in Power BI are created with the help of DAX formulas.
- Usually, all the measures are stored in a separate table for a better understanding of the measures.

